Almost every amorphous solid dispersion (ASD) is a metastable system: a drug in a polymer matrix in a high‑energy amorphous state, exposed to processing, water, and time.
ASD phase diagrams are the map of that system. They show where your API and polymer are miscible, when they phase‑separate, and how they respond to temperature, composition, and moisture. Once you have that map, every major formulation decision becomes faster, safer, and more defendable.
Think of ASD development as a tree. The ASD phase diagram is the root. Polymer choice, maximum drug load, process route, and shelf‑life are branches that grow from this root. Without it, the branches have nothing solid to grow from.
The ASD Phase Diagram Is Your First and Most Important Decision Point
The key question for every formulator is: under what conditions is this ASD stable and functional?
The binary API–polymer ASD phase diagram answers that for your specific pair:
- Where the system is fully miscible
- Where it splits into API‑rich and polymer‑rich phases
- How the glass transition temperature (Tg) shifts with composition
If your target composition sits in a thermodynamically unfavorable region of the ASD phase diagram, no amount of process tweaking or screening will make the system truly stable. You might get something that looks fine at t-zero, but phase separation and crystallization are ingrained. If the phase diagram shows a wide miscibility window and favorable interactions, you know the system has real potential, and where the limits are.
At amofor, we build ASD phase diagrams using a physics‑based thermodynamic model (PC‑SAFT). From a small set of experimental inputs, it calculates phase behavior from molecular interactions rather than empirically fitting each new system. This approach is backed by more than a decade of rigorous scientific research at TU Dortmund University, validated in over 80 peer-reviewed studies and more than 10 large industry-academia collaboration projects with big pharma. This makes it one of the most thoroughly tested tools for predicting miscibility, drug load limits, and phase behavior in drug formulation development.
That is why ASD phase diagrams are our first step in every project. Without a solid thermodynamic picture, all later choices lack a solid foundation.
From Binary to Ternary Diagrams: What the different ASD Phase Diagrams Tell You
A common misconception is that a phase diagram only shows miscibility. In reality, it encodes a wealth of formulation-critical information – and it is the root from which your entire development strategy grows. Each phase diagram allows diving deeper into the underlying mechanisms of a formulation.
Polymer selection. The binary phase diagram, computed across multiple polymer candidates, ranks them by interaction strength with your API. It identifies which polymer produces the widest miscibility window, the highest drug load ceiling, and the most favorable glass transition profile, before a single experiment is run. The approach is physics-based and has been validated against marketed ASD formulations. You start with a focused, high‑probability set of candidates and a clear idea of their limits.
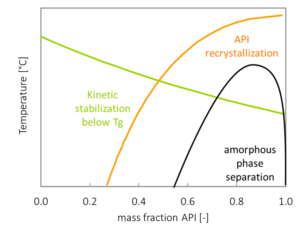
Example: Phase Diagram of ASDs (binary API polymer phase diagram)
Drug load. Once your polymer is selected, the phase diagram defines how far you can push the drug load. It quantifies the composition below which the drug stays molecularly dispersed and thermodynamically stable. Push beyond this boundary, and crystallization risk escalates fast. Add water, and this risk extends intodissolution behavior. Research from amofor in collaboration with AbbVie and Purdue University showed that discrete hydrophobic domains below the limit of congruency promote drug release, while continuous hydrophobic phases above that threshold block it entirely. Drug release phase diagrams map exactly where that threshold lies, before you invest in long series of dissolution tests [Deac et al., Mol. Pharmaceutics 2024].
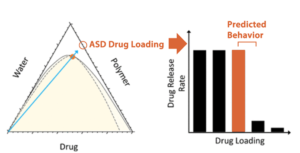
Example: ASD Release Phase Diagram (ternary API/polymer/water phase diagram)
Processability and manufacturing conditions. The shape and position of the miscibility and glass transition curves also dictate how friendly a system is to a given manufacturing route. From the miscibility and Tg curves in your ASD phase diagram, you can read:
- Whether hot‑melt extrusion has a realistic temperature window (miscible at feasible temperatures, with an adequate Tg margin)
- Whether spray drying is better because miscibility is strong in solution and at lower temperatures
- How sensitive the system is to small changes in temperature, composition, or residual solvent
Manufacturing ASD phase diagrams extend this to ternary API–polymer–solvent systems. As solvent evaporates, they tell you:
- Does the system stay in a one‑phase region until solvent is gone, yielding a molecularly dispersed ASD?
- Or does it cross a phase boundary early, triggering premature drug precipitation?
Instead of relying on trial‑and‑error process development, you define a safe process corridor directly on the relevant ASD phase diagram; the conditions where the drug remains molecularly dispersed [Collaboration AbbVie / TU Dortmund University]. Even the entire process map can be predicted with this approach [Predicting process design spaces for spray drying amorphous solid dispersions]
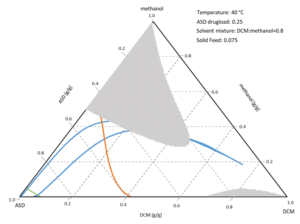
ASD Phase Diagram Example for a spray-drying process (ASD/solvent phase diagram).
Shelf-life. Waiting months for stability data only to see late crystallization is a familiar pain point. ASD phase diagrams, combined with humidity, give you a way to anticipate that behavior. The binary API–polymer ASD phase diagram maps Tg versus composition, showing how much thermodynamic headroom you have between storage conditions and the onset of increased mobility and crystallization risk. Humidity‑dependent ASD phase diagrams treat water as a third component in an API–polymer–water system. They show how moisture plasticizes the ASD and lowers Tg, how water shifts miscibility boundaries and at what temperature/RH combinations phase separation and crystallization become favorable research from amofor in collaboration with Janssen Pharmaceuticals demonstrated that this approach predicts crystallization onset times with an accuracy of ±20% across more than 150 long-term stability datasets [Grönninger et al., Mol. Pharmaceutics 2024].
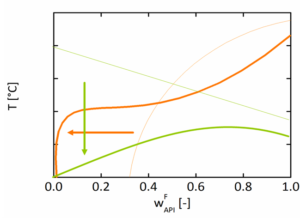
Example: ASD Phase Diagram at elevated humidity where the solubility and glass transition is pushed to very low values.
ASD Phase Diagram–Based Go/No‑Go Decisions
In practice, ASD phase diagrams support clear go/no‑go decisions very early in development.
- If the binary API–polymer ASD phase diagram shows no miscibility window at relevant compositions and temperatures, that API–polymer pair is a no‑go for ASD, before you invest in screening.
- If the ternary API–polymer–water diagram predicts a limit of congruency below your target drug load, that composition is a no‑go for robust release.
- If humidity‑dependent ASD phase diagrams show that typical ICH storage conditions push your formulation into a phase‑separated region with high crystallization driving force, that storage scenario is a no‑go for long‑term stability [Mutual Impact of Phase Separation/Crystallization and Water Sorption in Amorphous Solid Dispersions / Moisture-induced phase separation and recrystallization in amorphous solid dispersions].
Conversely, systems that show a broad miscibility window, a safe distance between target drug load and the limit of congruency, and sufficient Tg and miscibility margin under expected humidity can be flagged as go candidates for focused optimization rather than broad trial‑and‑error screening.
Start With the Root
At amofor, ASD phase diagrams are the entry point into a connected in‑silico workflow. Starting from as few as five solubility measurements, our PC-SAFT-based model derives the complete interaction profile of your API. From that single starting point, SOLCALC, amofor’s proprietary formulation software, generates ASD phase diagrams and extends them into polymer rankings, drug load maps, manufacturing process boundaries, and shelf-life predictions. Every output is anchored to the same thermodynamic foundation. Every decision becomes consistent, traceable, and defendable.
The next time your team debates polymer choice, drug loading, or processability look at the phase diagram. The framework for finding the right answer is already there.
Want to see how to start modern drug formulation? Contact Dr. Christian Lübbert for a personalized consultation. Share one current ASD challenge, and we’ll show you what its phase diagram looks like..