Most drug candidates entering development are poorly soluble, which limits their bioavailability. Over the past few decades, several formulation techniques have been developed to address poor solubility, including amorphous solid dispersions (ASDs) and lipid systems. However, for ionizable APIs, there is an additional layer to the problem. Their solubility is not constant. It depends on the pH of the surrounding environment, which changes as the drug moves from the stomach to the intestine.
This means that a useful solubility model must consider not only the API ionization, but also the effect of the dissolution medium and any switch to the stable solid form. PC-SAFT provides a mechanistic framework for considering these factors before formulation testing begins.
How does ionization shape pH-solubility?
A pH-solubility curve shows how much of a compound dissolves at a given pH. Every ionizable drug has a pKa, which is the pH at which half of its molecules are charged and half are neutral. The degree of ionization is a continuous function of the pH, but sharply around the pKa. Shift the pH by two units in either direction, and nearly all of the molecules will end up on one side or the other. An acidic drug becomes mostly charged and far more soluble above its pKa, and a basic drug does the same in reverse.
A simple everyday example is a kidney stone. Uric acid is a weak acid with a pKa of around 5.35 in urine. Above the pKa, uric acid mostly exists as the soluble, charged urate ion. Below the pKa, uric acid reverts to its neutral form, which barely dissolves and can crystallize into a kidney stone. Doctors treat uric acid stones by raising urine pH to 6.5 to 7.0, which pushes the equilibrium above the pKa and dissolves some uric-acid stones. A pH-sensitive drug crosses the same kind of threshold, and the curve marks where.
Why does the identity of the pH-adjusting acid affect the answer?
Another thing that can mislead formulators is: “pH 3” isn’t always the same. It matters which acid was used to reach that pH level. For example, adjusting a solution to pH 3 with hydrochloric acid adds chloride ions, while adjusting to the same pH with phosphoric acid adds phosphate ions. Different acids ionize to different extents, which changes the solution’s ionic strength. This affects the maximum amount of drug that can dissolve at an identical pH.
Cassens et al., (2013) used PC-SAFT to study lidocaine, thiabendazole, terfenadine, and their salts across a range of pH values. PC-SAFT can model how both drugs and acids ionize. For lidocaine, the maximum solubility reached at the exact same pH was:
- 500 mg per gram of water with hydrochloric acid
- 350 mg per gram of water with phosphoric acid
That’s a 30% reduction in solubility from switching the acid alone, with no change in pH.
When does raising the pH increase solubility, and when does it create a new solid?
Beyond a certain pH, the drug can also leave the solution and form a different solid, such as a salt, hydrate, or cocrystal. Each of these forms has its own solubility and stability.
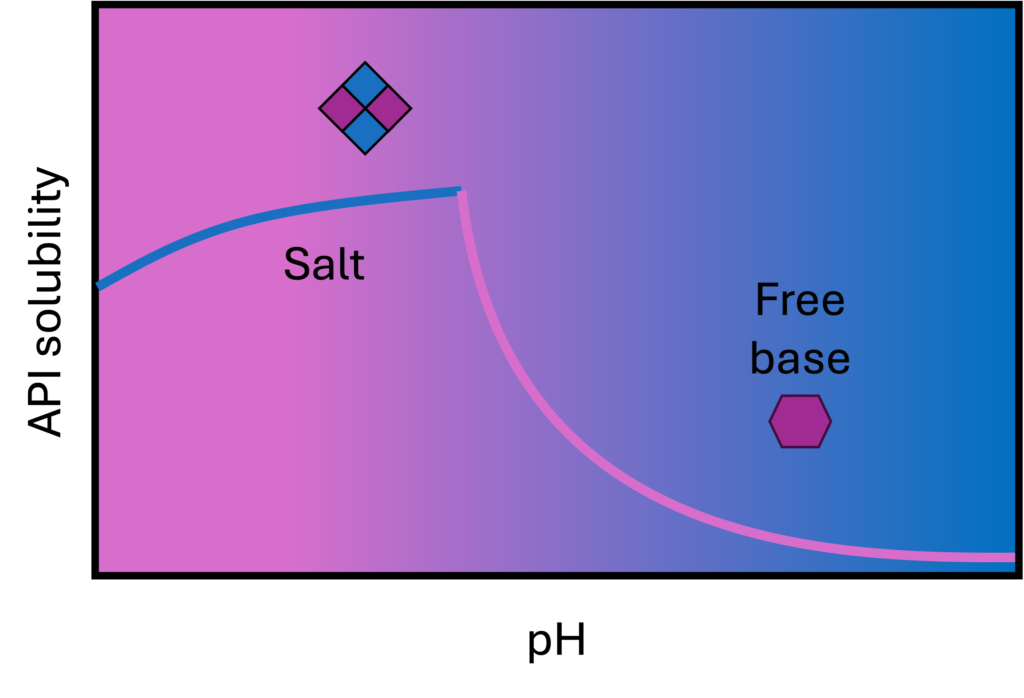
Figure: pH-solubility profile of a basic API. Blue represents the salt. Pink represents the free base. The two meet at pH max. Below pH max, the solid is the salt. Above pH max, the solid is the free base. Raising the pH beyond pH max does not dissolve more of the drug. A new solid forms and solubility decreases.
Lange et al., (2016) modeled this exact process in the caffeine/oxalic acid/water system as a test case. Using the PC-SAFT modeling approach, they determined that, across the pH range studied, the most stable solid form alternated between the free base and a 2:1 caffeine-oxalic acid cocrystal, with hydrates present as competing forms but never the most stable one in that window. The model matched experimental data with an average error of 10%, often less than 5%. At pH 1, the cocrystal remained stable over a broader concentration range than at pH 2 or 2.3; i.e. a one-unit shift in pH was sufficient to cause a change in solid form.
This risk is most significant for an ASD, as its primary advantage is maintaining the API in a metastable, high-energy state rather than its stable crystalline form. A seemingly harmless pH shift on a solubility curve can push the system toward the more stable solid form, eliminating the ASD’s advantage.
What determines where the polymers Eudragit and HPMCAS release their payload?
The same ionization logic that governs an API’s solubility also governs the polymers that control its release. HPMCAS and Eudragit are pH-sensitive, since their acidic groups progressively become ionized as the pH rises. This increases polymer hydration, causing the polymer to swell and dissolve. The polymer grade’s composition determines the pH at which this transition occurs.
HPMCAS-L, -M, and -H dissolve at approximately pH 5.5, 6.0, and 6.8, respectively. This is a direct result of the decreasing succinoyl content. Succinoyl groups are ionizable carboxylic acid moieties on the polymer backbone. More succinoyl content means more acidic groups are available to deprotonate at a given pH. This allows the polymer to ionize and dissolve at a lower pH. Eudragit L100-55, L100, and S100 dissolve across a comparable pH range of 5.5–7.0 (Khan et al., 1999).
Consider an ASD in which the intrinsic solubility of the API does not depend on pH, but that of the carrier polymer does. In this case, the pH is adjusted to promote the polymer’s ionization and dissolution. The dissolution of the polymer matrix releases the molecularly dispersed, amorphous API into the aqueous phase. This can generate a highly supersaturated solution, even though the solubility of the API itself has not changed.
Whether a trigger pH is the right one depends also on where in the GI tract it is crossed. Gastric pH is around 1.7 when fasting and rises to approximately 6.1 in the duodenum (Dressman et al., 1990). That trigger can be predicted in silico with SOLCALC before any lab testing. If a grade is chosen without checking its trigger pH against the target release site, the release will occur either too early, in a region where the surrounding fluid cannot sustain supersaturation, or too late, after the absorption window has passed.
What can you decide once these pH-dependent relationships are mapped?
Using amofor’s PC-SAFT-based platform and running it through SOLCALC yields a pH-solubility curve, a solid-form stability map, and a polymer’s trigger pH, all of which come from the same mechanistic model. When treated this way, the curve directly answers key formulation questions.
- Does switching the dissolution medium or pH adjuster, such as hydrochloric, citric, or phosphoric acid, change the number I am actually measuring?
- At my target pH, am I still working with the same solid or have I precipitated an unplanned salt, hydrate, or cocrystal?
- Which HPMCAS or Eudragit grade’s calculated trigger pH matches the GI transit window I want?
- Which aspects of this behavior can I predict before running a dissolution test, and which genuinely require in vivo data?
Together, these answers provide a solubility profile for the API, a defensible pH buffer and dissolution medium, a solid form risk map across your working pH range, and a polymer grade selected based on calculated trigger pH rather than by label.
If you need to select a pH-adjusting agent, screen HPMCAS or Eudragit grades for a target release site, or determine if your ASD formulation’s pH is close to a solid-form boundary, contact Dr. Christian Lübbert to apply this mechanistic approach to your formulation.